What you see
What you see
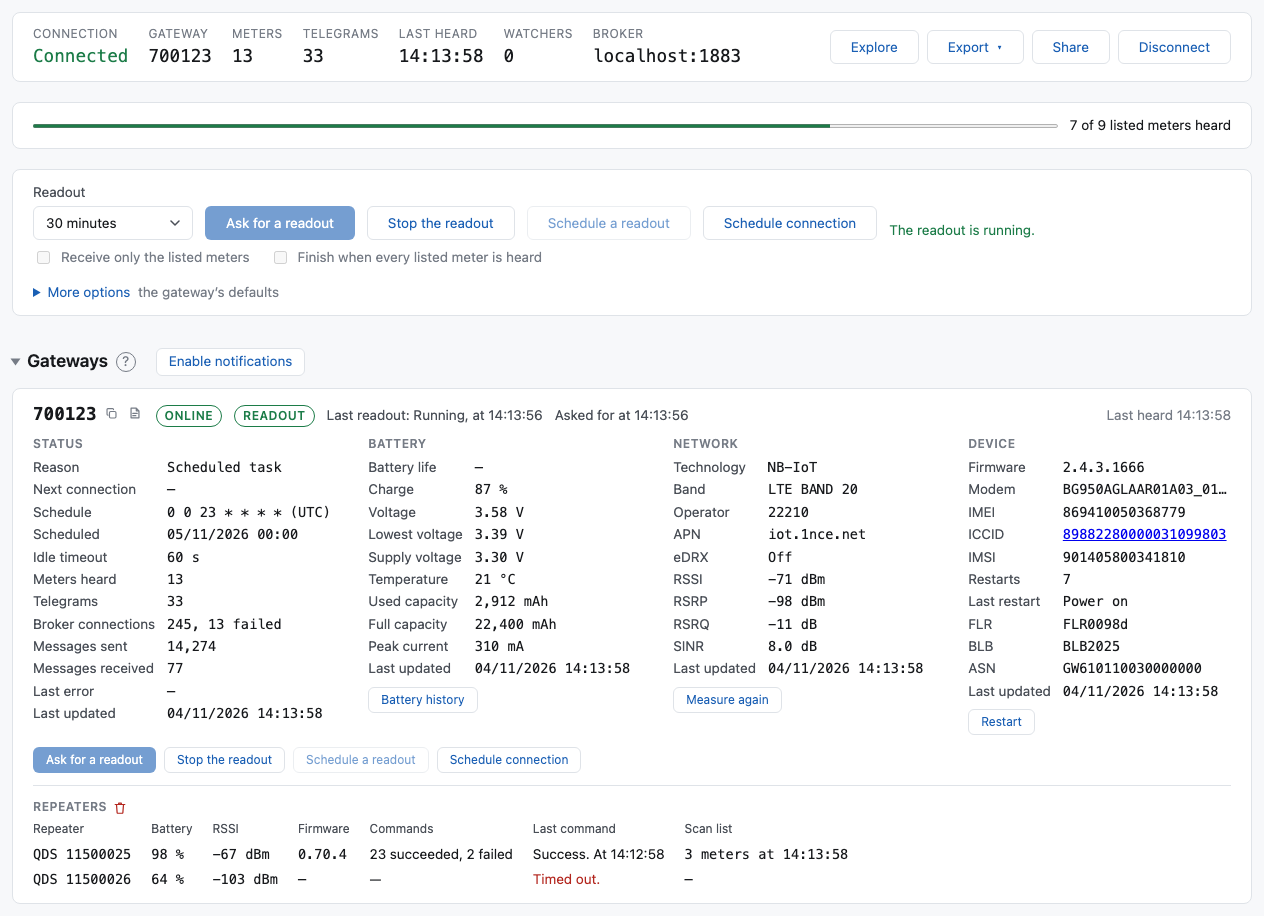
At the top, one line of facts about the session:
- Connection: Connecting, Connected, Failed, Closed or Ended, with a line under it that says why when it failed.
- Gateway: the id you named, up to three ids, or how many (20 gateways, with the ids in the tooltip), or every gateway.
- Meters and Telegrams: how many have been heard so far.
- Last heard: the time of the last telegram, or never.
- Broker: the preset's name and the broker's address, or only the address when you typed one. Only you see it. A watch link does not show it.
When you listed meters at Connect, a bar under the summary says how many of them have been heard: 6 of 8 listed meters heard.
Under that are six sections: Gateways, Queued actions, Meters, Signal, Map and Gateway raw data. Signal is there when you listed meters, and also when you named one or more gateways at Connect. Map is there with Signal, for somebody signed in. Click a section's heading to close it, and click again to open it. The browser remembers which sections you closed.
Meters to expect
Type the serial numbers of the meters that should be there into Meters to expect before you connect. Then:
- Each listed meter has a row from the start. Its Forwarded by cell says Not heard yet until its first telegram arrives, and then names the gateway that heard it.
- The bar under the summary counts how many listed meters have been heard.
- A meter that is not on the list is still shown, with a white ! in a red circle beside its serial. Move the pointer over it to read why.
- The Signal section shows the listed meters against the gateways that heard them. With no list it shows every meter the gateways you named have been heard by instead.
- The readout can use the list — see Asking for a readout.
The list only counts; it hides nothing. To change it, disconnect and connect again.
The Gateways section
One card for each gateway the session has heard. When you name a gateway, its card is there from the start and says Nothing received yet until the gateway connects.
Every part ends with Last updated, the time the message that filled it arrived, always with its date. Status is drawn from three messages, so it says the newest.
The red bin beside a part's name, for an administrator, clears what the bench kept of that part for that gateway, and takes those values off the card. What this session heard stays. The gateway sends them again when it connects, and some only after a restart, so use a bin when what is kept is wrong — after a gateway is replaced, for instance. A part that holds nothing kept has no bin. Device has no bin at all: a gateway sends that part only after somebody restarts it by hand, and the bench reads the firmware version from it. A gateway that restarts replaces it.
A repeater's scan list is never kept. It says what a repeater heard and how strongly, which is true of a moment, so the Signal section shows one read in this session or nothing at all. Set Read the repeaters' scan lists to On for a readout to take a fresh one.
A card starts with what the gateway last said, even in an earlier session. A gateway sends what it is, its battery, its radio, its counts, its schedule and its repeater table only when it connects after a restart, so a session opened later would hear none of it. The bench keeps those parts and fills the card with them. Move the pointer over a part's heading: it says Remembered from with the date, or Received at with the time for something this session heard. A remembered part is what the gateway last said, not what is true now, so the gateway still counts as not heard, and the buttons that need it online stay closed until it connects.
A gateway can have a name and notes. The name is under the id when the card is open, and the notes are behind the button with a page on it, beside the id: grey when there are no notes, black when there are. Move the pointer over it to read them. Press it to read or change the name and the notes; the window says who wrote them last, and when. Anybody signed in, but not a contractor, can change them. They belong to the gateway on that broker, so every session and monitor on the broker shows the change at once.
When you watch every gateway, or several, each card starts folded to one line: its id, whether it is online, its charge, its RSRP, how many meters it heard, and when it was last heard. Show details opens the card and Hide details folds it again.
At the top of the card are the gateway's id, whether it is Online or Offline, a tag for a readout you asked for (Waiting, Readout while it runs, then Finished, Cancelled or Stopped; move the pointer over it for the full sentence), its last readout (whoever asked for it) with the telegrams, the meters and the errors it counted and the list it used, Asked for at with the time this session asked for its readout, and when anything last arrived from it. The two times are different things: one is when you asked, the other is when the gateway answered. When a readout does not seem to start, compare them. A battery gateway is offline most of the time, so Offline is not a fault. Under that are four parts. Every part always shows all its names, with a dash where the gateway has not sent a value, so the card does not change shape as messages arrive:
- Status
-
Why it last connected, when it expects to connect again, how many meters and telegrams it forwarded in this session, its broker connections and messages sent and received since it last restarted (
gw/stats), its schedule, its next scheduled connection (the next three are in the tooltip) and its idle timeout (reconnect/info, sent after a restart), and what its last error means, from the gateway's specification (the code, topic and time are in the tooltip).From:
gw/connstatus,gw/stats,reconnect/info,dm/status, any…/error - Battery
-
How long the battery has left, charge, voltage, lowest voltage, supply voltage, temperature, used capacity, full capacity and peak current. The temperature is the air around the gateway, not the battery's. Battery history draws the charge day by day. For an administrator, the New battery button.
From:
battery/info - Network
-
Technology (NB-IoT or LTE-M), band, operator (its MCC and MNC as one number), APN, eDRX, RSSI, RSRP, RSRQ and SINR. Move the pointer over eDRX or a signal name to read what it means. The Measure again button, while the gateway is online: the gateway measures its signal again and sends the new values. Its connection pauses for two or three seconds while it does. For an administrator, the eDRX and Reset the modem buttons.
From:
network/info - Device
-
Firmware, modem, IMEI, ICCID, IMSI, how many times it restarted, why it last restarted, and the FLR, BLB and ASN printed on the device, which Qundis support asks for. A long modem name is cut short; move the pointer over it to read all of it. The ICCID opens that SIM in the SIM bench, in a new tab. The Restart button, and for an administrator Update the firmware.
From:
gw/info
Repeaters appear under the parts when the gateway has sent its repeater
table (repeater/table, then repeater/info for each): each repeater's
serial number, battery, RSSI, firmware, how many commands to it succeeded and
failed, the result of the last command, and how many meters are on its scan
list, when a readout asked for it (see More options). A gateway sends the table when it
connects if its repeaters changed, and after a readout that used them. A
gateway that never sends one shows no Repeaters section.
Under the four parts, across the whole card, are this gateway's Ask for a readout, Stop the readout, Schedule a readout and Change the schedule buttons.
Each part shows the newest message of its kind. Move the pointer over the part's name to see when it was received, or why nothing has arrived yet. A gateway sends its battery and network each time it connects, and its device details only after a restart. Until the message arrives, its values are a dash. The last readout is on the card whoever asked for it, the collecting system or you.
The same messages are also lines in Gateway raw data, exactly as they arrived.
The Meters table
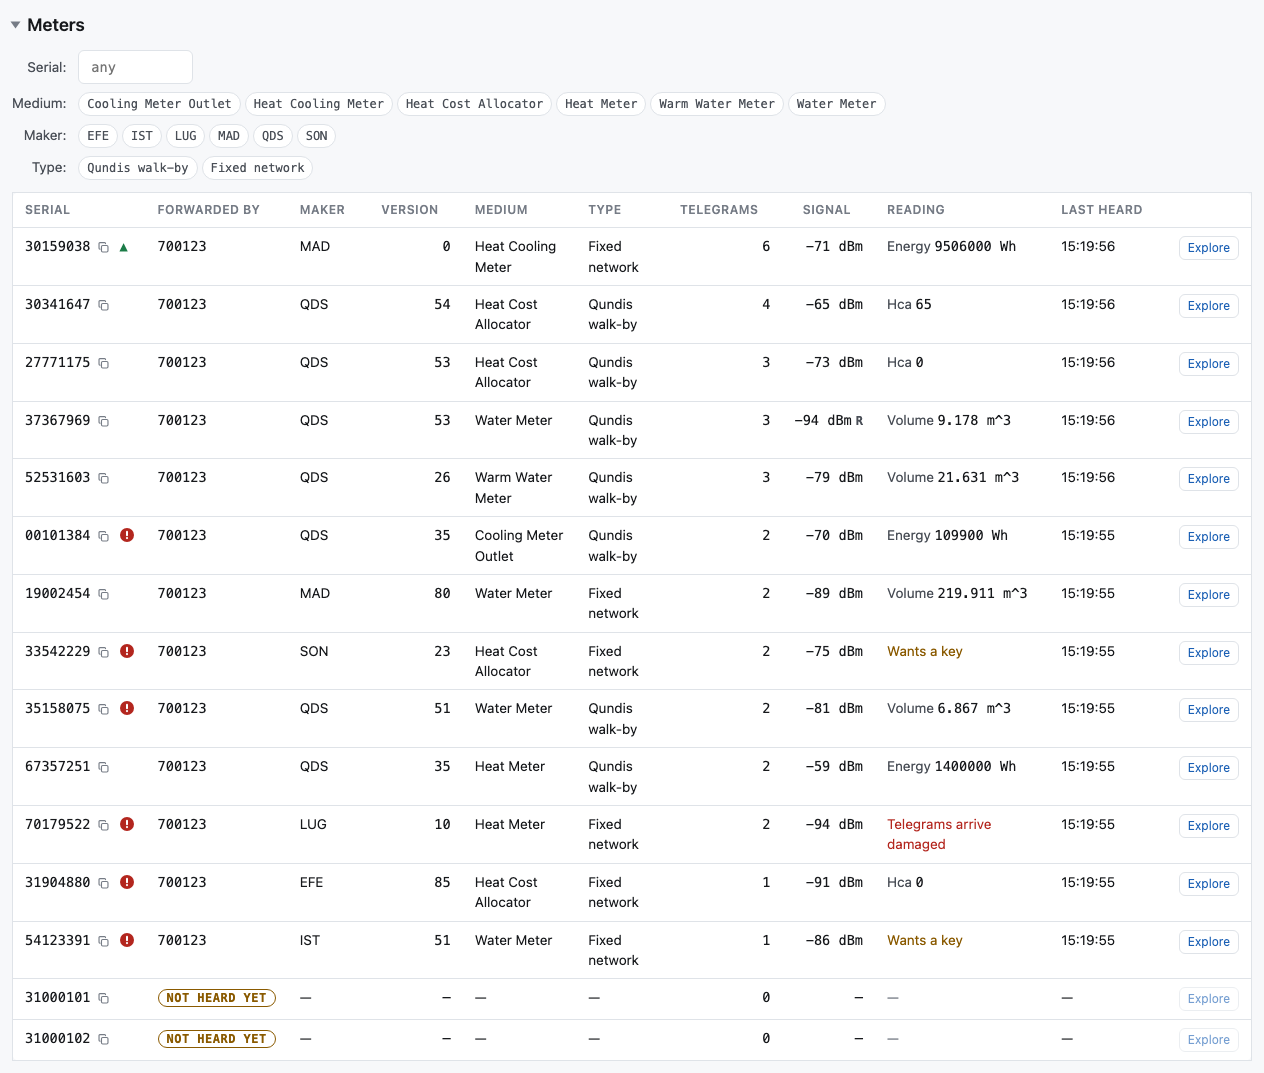
One row for each meter heard, keyed on its address.
- Serial
- The meter's serial number. A red mark beside it: the meter is not in Meters to expect.
- Forwarded by
- The gateways that sent this meter's telegrams on, or Not heard yet for a listed meter. A gateway forwards what it hears itself and what a repeater carried to it, so this names the gateway, not always the device that heard the meter. Shown when you watch several gateways or every gateway, and when you listed meters.
- Maker, Version, Medium
- What the telegram says about the meter.
- Type
- Every kind of telegram that meter has been heard with, as the gateway reports it: Fixed network, Walk-by, Qundis walk-by, OMS, Installation, Monitoring, Status. A meter sends several, so the cell often says two. Move the pointer over it for the specification's codes.
- Telegrams
- How many telegrams it sent since the session started.
- Signal
- The signal strength of the last telegram the meter sent straight to a gateway, in dBm, and an R where a repeater carried telegrams of it. An R with no number means every telegram of that meter came through a repeater; the tooltip says how many.
- Reading
- The meter's main value now: heat cost units for an allocator, volume for a water or gas meter, energy for a heat, cooling or electricity meter. Click the row for the others.
- Last heard
- When its last telegram arrived.
Forwarded by names every gateway, not only the last one. Gateways in neighbouring buildings hear each other's meters. That is normal, and a meter forwarded by two gateways is not a fault.
Where the Reading column has no value, it says why:
- Wants a key: the meter encrypts, and no key you gave opens it. Add its key to AES-128 keys and connect again.
- Telegrams arrive damaged: the bytes arrive, but they cannot be read. That is usually radio: distance, a wall, or another transmitter.
Click a column heading and the table is ordered by that column. Serial, Maker, Version and Medium start at A; Telegrams, Signal and Last heard start at the busiest meter, the strongest signal and the most recent telegram. An arrow on the heading says which column is ordering the table and which way.
- Click the same heading again and the order is reversed.
- Click it a third time and the table is as it was: the meters with the most telegrams first.
- Only one column orders the table at a time.
- A meter with nothing in that column — a version it has not said, a telegram that carried no signal — is always last, whichever way the column is ordered.
- Forwarded by, Type, Reading and the last column cannot order the table: the first is a list, the third has a different unit on each row, and the last holds a button.
Ordering and narrowing are two different things. Clear filters clears the choices below, and leaves the order as it is.
To narrow the table, use Serial and the Medium,
Maker, Type and Version choices. Serial takes part of a
serial, or several, separated by spaces, commas, semicolons or lines, such as
11317663;11317579 or a column pasted from a spreadsheet: a meter is shown
when any of them is part of its serial. Type is the kind of telegram,
and a meter is shown where it has been heard with any of the kinds you choose;
the row appears once a gateway has reported a kind, which needs firmware 2.4. When you watch every gateway there is also
Forwarded by, and Show its meters on a gateway's card chooses that gateway
there and clears the other choices. Version appears after you choose a
maker. Clear filters shows every row again, and the line under the table
says how many rows are shown.
What a meter is counting, and how it moves
Click a meter's row and it opens. Under it is every register the meter is counting into now — its energy, its volume, one line for each water meter wired to it, and one for each tariff it counts under. A heat meter that also cools counts the cooling under a tariff of its own. The subunit and the tariff are written beside the name, so two lines of one name are two registers and the numbers say which. The Reading column beside the row shows one value; this shows them all. What this list leaves out is what the meter is not counting into now: a past period and a maximum. Click the row again and it closes.
A mark says how far a value has moved since the session first heard the meter:
- A green ▲ and a number: a counter that has risen, and how far.
- An orange ▼ and a number: a counter that has fallen. A counter only rises while a meter works, so this is worth looking at.
- A ~: a value that moves both ways in normal use — a power, a flow — and that has moved. It keeps the mark even when it comes back to where it started, because it did move.
- Nothing: a temperature, or a value nobody has seen move yet.
The meter's own row carries one mark, beside its serial, so a row you have not opened still says whether anything on it moved. It is orange and downward when any counter on the meter fell, green and upward when one rose, and a green ~ when only a gauge moved. A counter comes first: a fall is worth looking at, and a gauge that moves says only that the meter is answering with live values.
Move the pointer over a mark and it says what it was measured between: the first value and when it arrived, and the value now and when it arrived. Over a ~ it says since when the value has moved, and what it reads now. On the meter's own mark it lists every quantity behind it.
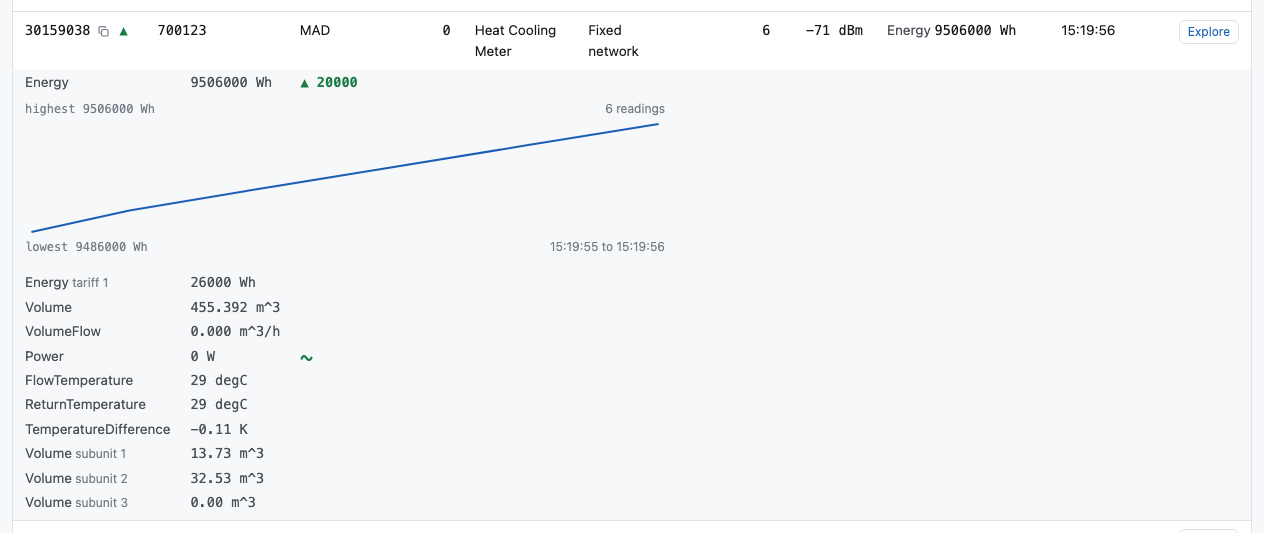
Click a quantity and it opens a chart of its own readings, one for each telegram of this meter the session still holds. Under and over the line are the highest and the lowest reading, how many readings there are, and the time the line spans. Click again to close it. A meter heard once has no chart, since a line needs two readings; a meter heard early in a long session may have fewer readings than telegrams, because the session keeps the most recent telegrams and not all of them.
The Signal section
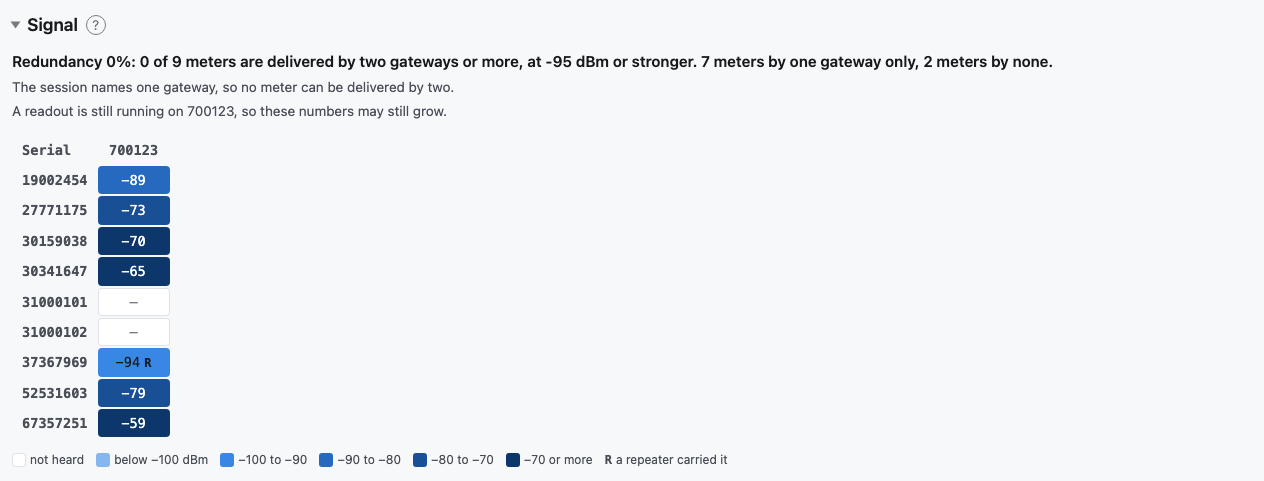
Shown when you listed meters, and also when you named one or more gateways at Connect. One column for each gateway that heard one of the meters in the map.
The rows are the meters you listed. With no list, they are every meter the gateways you named have heard, and a meter has a row from its first telegram, where a listed meter has a row from the start. Only a session that watches every gateway on the broker with no list has no map at all: there would be hundreds of rows and nothing to choose between them.
Asking a gateway for a readout empties its column, so the map is about the readout you are watching and not about the one before it. Move an antenna, ask for another readout, and what fills the column again is what the gateway hears now. Only that gateway's column: another gateway goes on saying what it heard. The Meters table keeps its counts and its readings across readouts. A cell is the RSSI of the newest telegram that gateway received from that meter, in dBm: darker blue is stronger, and the number is always written in the cell. A dash means that gateway has not heard that meter. The gateways you named have a column even when they have heard none of the meters in the map.
The number in a cell is the meter's own signal at that gateway and never the repeater's: the signal of a repeated telegram is the repeater's signal at the gateway, so a cell holding either would tell you neither. An R beside the number says a repeater carried telegrams of that meter, and an R with no number says that gateway has received the meter through a repeater and not itself. Move the pointer over a cell to read how many telegrams came each way.
Set Read the repeaters' scan lists to On, under More options, and each repeater gets a column of its own instead. The column is marked R and the repeater's serial number, and after a readout it shows what that repeater hears, and how well. The last row, Link to gateway, is how well the gateway hears each repeater, from its repeater table. Read a repeater's column and then its last row, and you have the whole path: meter to repeater, and repeater to gateway. The R marks in the gateways' cells go, because the columns say the same thing and say it better.
Without that option nothing can fill those columns — a repeater tells the gateway what it hears only when a readout asks it to — so they are not shown, and the map is the gateways alone with the R marks. A scan list already read stays on the map whatever the option says afterwards.
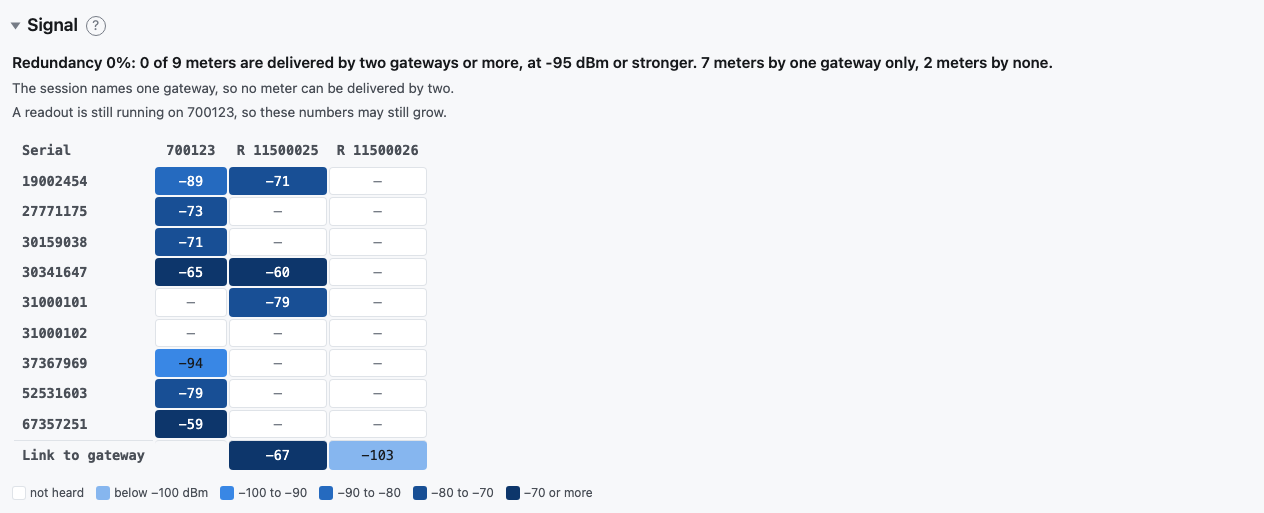
Move the pointer over a cell to read how many telegrams that gateway forwarded from the meter, how many a repeater carried, and when the newest arrived.
To read the map in a spreadsheet, use Export, then Signal (Exporting a session).
Redundancy
A large building should have more than one gateway, so that one gateway that fails loses no data. The line above the map says how close the building is to that. It is shown when you named the gateways and listed the meters at Connect.
A gateway delivers a meter when it received a telegram of it at −95 dBm or stronger since its last readout. A meter delivered by two gateways or more is still received when one gateway fails. The line gives that share of the listed meters, how many are delivered by one gateway only, and how many by none.
The line under it gives, for each gateway, the meters lost if that gateway fails: the meters only it delivers. That is the gateway to move, or to give a second gateway beside it. With two gateways or more, the Gateways column of the map gives the same count for each meter: amber for one, red for none.
- A telegram a repeater carried counts for the gateway that received it. If that gateway fails, the repeater's path fails with it.
- Only the gateways you named count. A neighbour's gateway reads on its own building's schedule.
- A readout empties its gateway's column, and the count with it. For a fair score, ask every gateway for a readout and read the line when they are all finished. While one is still running, the line says so.
The −95 dBm is a setting of the bench, in its environment file. Whoever runs the bench can change it.
Ordering the map
Press a heading of the map to order it:
- Gateways puts the meters delivered by the most gateways first.
- A gateway's id puts the meters it hears best first.
- A meter's serial, at the start of its row, puts the gateways that hear that meter best first.
A cell with no signal of the meter's own goes last. Press the same heading again to go back to the first order. The line of the meters lost if a gateway fails names the gateway that loses the most first.
The Map section
The Map section, after Signal, is for somebody signed in. It is shown wherever the Signal section is. Place each gateway, meter and repeater where it is, and the map draws lines from the meters to the gateways that hear them, coloured by the signal as a cell is.
Beside the map is the list of the devices, in three groups: gateways, repeaters and meters. Search a serial to narrow it, or tick Only not placed. You can search several serials at once: separate them with spaces or commas, or paste a column copied from a spreadsheet. A line under the search says how many of them are in this session and which are not; All shown then ticks them all. Press the small ‹ button beside the list to fold it to the left, and the map takes the whole width. Press › to bring the list back.
- To place devices, tick them in the list, press Place, then press the map where they are. Press a marker instead to add them to that point. All the meters of one building can be placed with one press. Escape stops. All shown ticks every device the list shows.
- To move a point, drag its marker. Every device at that point moves.
- To move some devices of a point, press the marker, then Tick them in the list, untick the ones that stay, and place the others.
- To remove devices, tick them and press Remove, or press a marker and then Remove from the map.
The devices at one point are one marker, with their count where there are several: a square where a gateway is, a purple square where a repeater is, a circle where there are only meters. A circle is red where one of its meters is delivered by no gateway, and amber where one is delivered by one only, as in the Gateways column.
One line joins the meters of a point to each gateway that hears them, however many meters there are. Its colour is the middle signal of those meters. Move the pointer over a marker to read its label. To see the labels at all times when the map is close enough, remove the tick from Labels only under the pointer, below the address search. Move the pointer over a line to read how many of them that gateway hears, the strongest, middle and weakest signal, and the distance. A dashed grey line is a gateway that hears none of them itself: only through a repeater, or with no signal given.
Press a marker to see only its lines, and Show in the list to see only one device's: a gateway's lines, or one meter's own lines with its own signal. Press the map to see every line again.
A position belongs to the device, not to the session, so every session that holds that gateway or meter shows it in the same place.
To find a building, write its address in Address, at the right of the Street map button, and press Enter or Search, then choose the place in the list. The map moves there, close enough to place devices. The search is OpenStreetMap's, and the address you write is sent to it.
Floor plans
A floor plan is an image of one floor of a building, PNG or JPEG, up to 8 MB. It is kept with the preset the session was opened from, so only sessions of that preset show it. A session you opened by typing a broker has no plans.
- To add one, press Add a floor plan over the map, give it a name such as Ground floor, and choose the image. The map shows it at once.
- To change what the map shows, press Street map or a plan's name.
- To place devices on a plan, open the plan, then tick and place them as on the street map. A device can be on several plans, at its own point on each: a gateway in the stairwell can be drawn on every floor. In the list, a device also on other plans names them.
- To remove devices from a plan, use Remove from this plan. The device stays on the other plans.
- To rename or delete a plan, open it and press Rename or Delete. Only who added it, or an administrator, sees those two. Deleting a plan removes the devices placed on it.
On a plan, a line joins devices on the same plan only, and says no distance: a plan has no scale. The positions on a plan and on the street map are kept apart, and the same gateway can be in a different place in each preset.
Importing a Signal file
An export can be drawn again later, with no broker and no gateway. You need to be signed in.
- On the home page, press Import a Signal file.
- Choose the file: the one that Export, Signal saved.
- Choose the Preset the file belongs to. Its floor plans are then in the Map section. With no preset, there is only the street map.
- Press Import.
The session shows the Signal section and the Map section. Everything is drawn as it was in the session that saved the file, and it does not change. A device you placed before is already in its place, and you can place the others.
A file holds only what its columns say, so a meter's readings and a gateway's card are not there. The session ends when nobody has read it for a while, or when you press Close. Import the file again to see it again.
Gateway raw data
Everything the gateway says that is not a meter's telegram, newest first: whether it is online, the state of a readout, its battery and network reports. Each line has four columns: GW ID, Timestamp, Topic and Message. The message is the payload exactly as it arrived. The bench adds no sentence of its own.
The topic is the whole topic under the gateway, so it says which way the
message went: ul/… is the gateway speaking and dl/… is the bench. Only the
part that is the same on every line — the prefix and the gateway's id, as in
nrg/qgw6direct/11324461/ — is taken off.
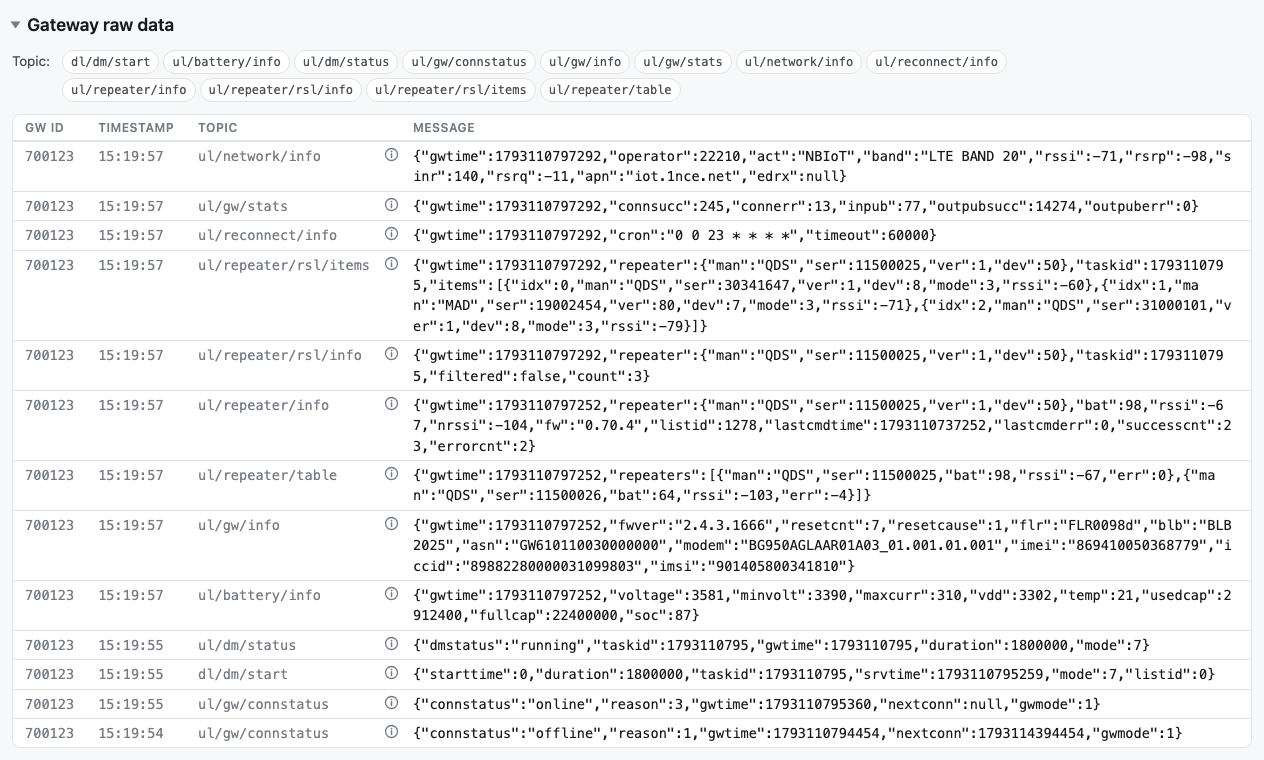
The (i) on a line explains the message. Move the pointer over it, or click it on a phone. It shows the same message with each number given its meaning: the reason for the connection, the radio mode, a time as a date and a time in your own time zone, a voltage in volts, an error code with its description. A click keeps it open until you click again or press Escape. The line itself is still exactly what was sent.
To narrow the lines, choose one or more topics under Topic, and, when you watch every gateway, one or more gateways under Gateway. Clear filters shows every line again, and the line under the table says how many are shown.
Every command the bench sends is in the log too, under dl/… — a readout's
dl/dm/start and dl/dm/stop, a list's dl/filterlist/add, and the others
below — so you can see exactly what was asked for.
It keeps the last 200 lines.
The messages of a gateway
Gateway raw data is the session's, and it is gone with the session. The bench also keeps the messages of each gateway, so you can read what was sent to a gateway yesterday and what it answered.
Press Messages on a gateway's card. A dialog shows every message sent to that gateway and received from it on this broker, in any session: yours, somebody else's, or a logger's. The telegrams of the meters are not there. The columns are the ones of Gateway raw data, and the Timestamp has the date. The newest message is first, and the (i) on a line explains it.
- The dialog does not change while it is open. Press Read again for the messages that arrived after you opened it.
- It shows the newest 1,000. The bench keeps the newest 5,000 for each gateway and deletes the older ones.
- Download saves every message that is kept as a text file, oldest
first. Each line has the time in UTC, the gateway,
>for a message the bench sent or<for one it received, the topic and the message. - A message is kept from the day this was added, 7 October 2026. Nothing older is there.
- You see the button when you are signed in. A contractor does not see it.